See where impact concentrates
An impact score for every area, combining the forecast hazard with who is exposed and how vulnerable they are.
Portfolio Risk · for insurers and risk teams
Portfolio Risk scores the next 48 hours of extreme heat and high winds against the people and facilities in each area, so risk teams can see where impact concentrates and which locations to call first.
Photo: Roc0ast3r / Wikimedia Commons, CC0
The problem
Hazard maps show where the weather is. The real question is which of your locations it matters for.
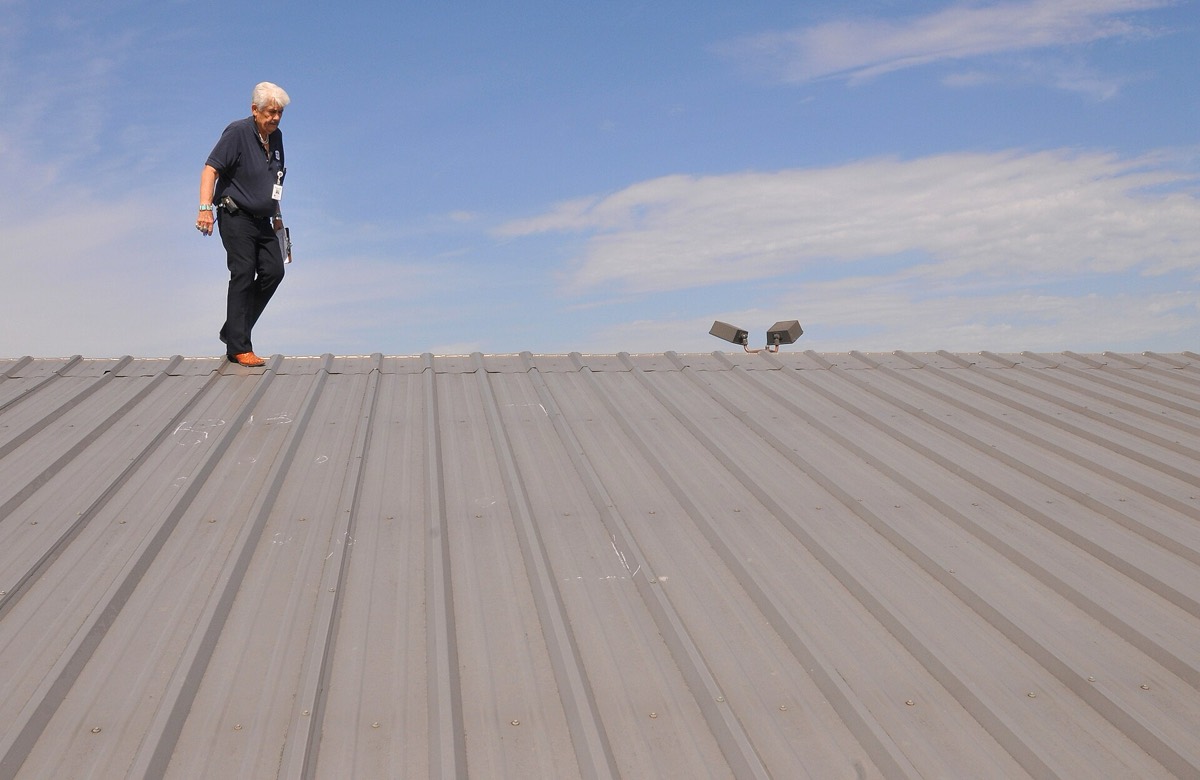
When heat or wind builds, risk teams check forecasts, location lists and long-term risk data in separate tools, then still have to judge which locations to worry about first.
Business value
An impact score for every area, combining the forecast hazard with who is exposed and how vulnerable they are.
Critical facilities and locations ranked by heat and wind risk, with the confidence behind each score.
Long-term baseline risk and historical damage alongside the live forecast, for client advisories and loss-control calls.
How it works
Every score can be traced back to the hazard, exposure and vulnerability behind it.
Hourly heat and wind forecast, 48 hours ahead.
How severe the heat or wind is at each place and hour.
How many people, and which facilities, are there.
How sensitive each community is to heat or wind.
One 0–100 score and severity band for every area.
Each facility scored for heat and wind from its surrounding area.
A ranked list of where to look first, with confidence and history.
How each team uses it
Which insured locations to contact first when heat or wind builds.
Where live risk concentrates across the book, next to long-term baseline risk.
A clear, explainable reason to reach out to a client before the event.
Hospitals, schools and care facilities ranked by exposure for the next 48 hours.