Stage ahead of impact
Ranked asset risk and a peak-hour view up to 48 hours out, so staging starts early instead of in a scramble.
Storm Readiness · for infrastructure & operations teams
Storm Readiness turns a severe-weather forecast into a ranked view of asset risk, service impact and staging decisions, so operations teams can pre-position crews and materials with a clear reason for every call.
Photo: NOAA NSSL, public domain
The problem
Forecasts describe the weather. Operations needs to know what it will do to assets and services.
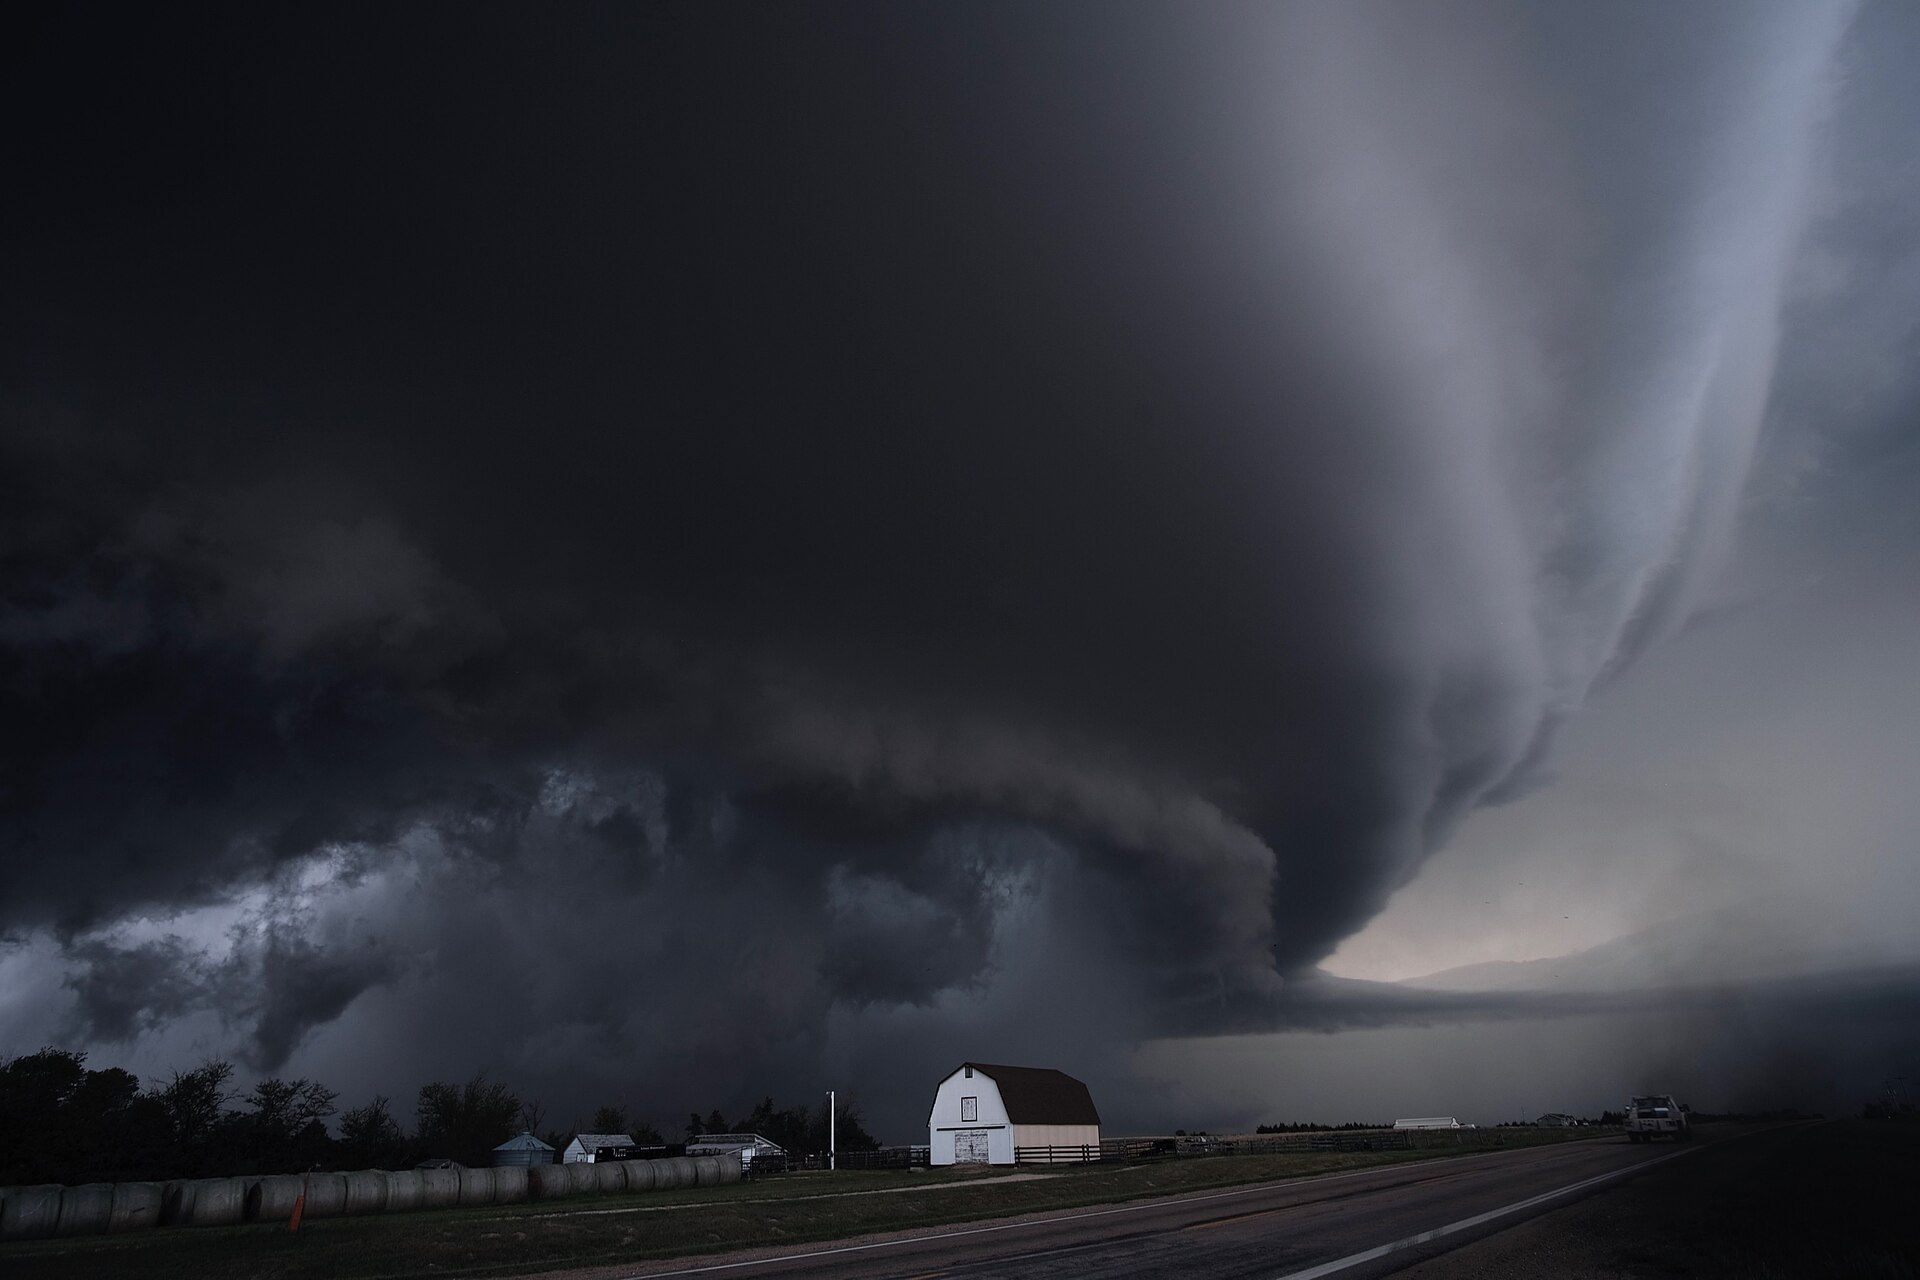
Ahead of a storm, teams stitch together forecast maps, radar, asset records and experience to decide where to send crews. It is slow, hard to explain after the fact, and it rarely says how confident anyone should be.
Business value
Ranked asset risk and a peak-hour view up to 48 hours out, so staging starts early instead of in a scramble.
Switch between expected and worse-case scenarios and see how the storm footprint, ranking and staging change.
Event replay and exports show what the board knew at each hour, with sources and timestamps, for after-action and regulatory review.
How it works
Every number on the board traces back through the same decision chain, and every step carries its source.
High-resolution forecast, radar and surface observations.
Wind, rain and convective intensity over your area of operations.
Which assets and sites sit in the storm footprint.
How susceptible each asset is to that hazard.
A bounded probability of failure per asset, with its drivers.
People and services affected, and the peak-impact window.
Staging, recovery outlook, alerts and playbook steps.
Who gains, and how
One shared picture of where risk concentrates and how it shifts with lead time and scenario.
Staging tied to specific assets and a peak-impact window, not a regional guess.
An early view of services at risk and the recovery outlook, updated as observations arrive.
Every event replayable, with the sources and timestamps behind each decision.